
完整程式碼在此
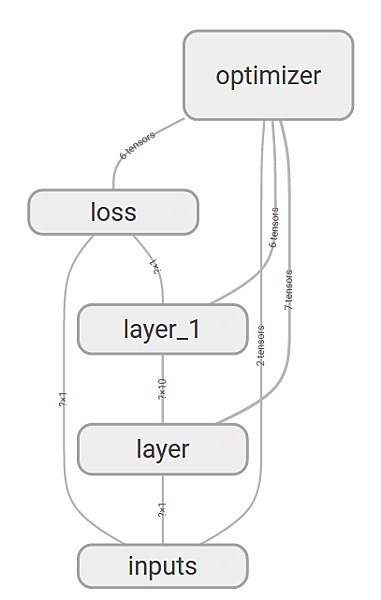
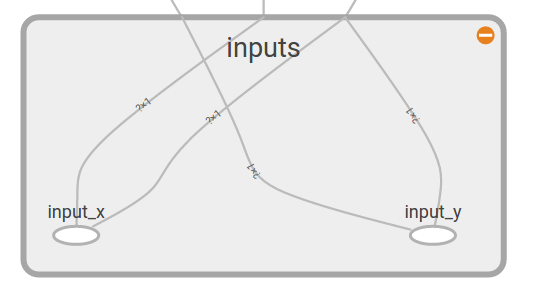
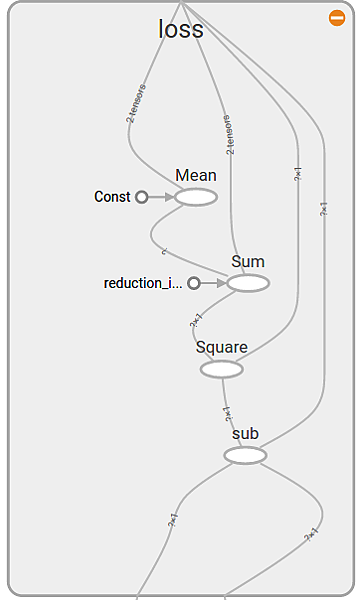
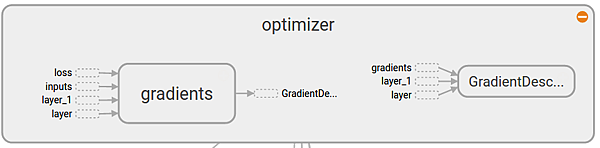
整個graph 完整架構:
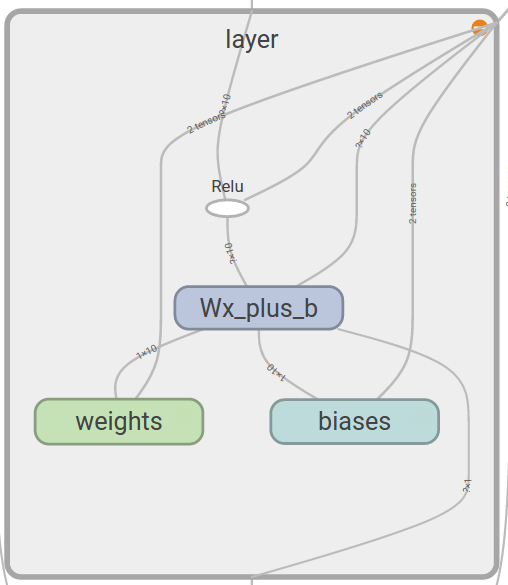
第一層會採用原本的名稱,第2層開始會name_1,2…以此類推
# 最重要的一句~ 把所有的命名都傳給sess.graph中
writer = tf.train.SummaryWriter(“logs/”, sess.graph)
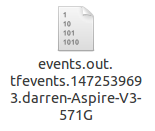
接下來run 程式碼 就會在原始碼資料夾底下產生另一個資料夾 logs

裏面有一個檔案
cd 到程式碼放的地方
執行以下指令
tensorboard –logdir=’logs/’
程式執行結果:
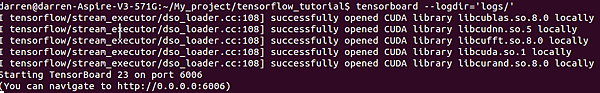
之後就可以去網頁打以上所寫的ip位置 打開tensorboard,點擊graph 就可以看到小編看到的圖囉~

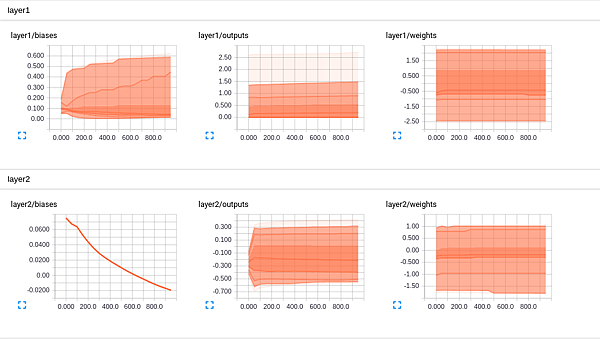
加上 Events 和 Histograms
底下為程式碼 我直接把他用顏色標記出來哪裡不同
要加入histogram 只需要再那個變數下面加入一行即可
前面參數為在tensorboard顯示的名稱 後面參數為要紀錄的
import tensorflow as tf
import numpy as np
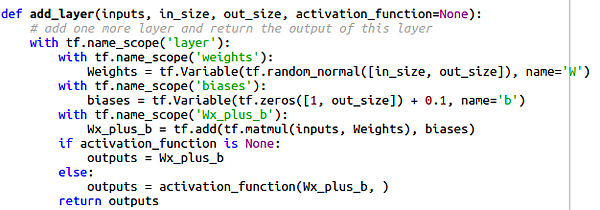
def add_layer(inputs, in_size, out_size, n_layer, activation_function=None):
# add one more layer and return the output of this layer
layer_name = ‘layer%s’ % n_layer
with tf.name_scope(layer_name):
with tf.name_scope(‘weights’):
Weights = tf.Variable(tf.random_normal([in_size, out_size]), name=’W’)
tf.histogram_summary(layer_name + ‘/weights’, Weights)
with tf.name_scope(‘biases’):
biases = tf.Variable(tf.zeros([1, out_size]) + 0.1, name=’b’)
tf.histogram_summary(layer_name + ‘/biases’, biases)
with tf.name_scope(‘Wx_plus_b’):
Wx_plus_b = tf.add(tf.matmul(inputs, Weights), biases)
if activation_function is None:
outputs = Wx_plus_b
else:
outputs = activation_function(Wx_plus_b, )
tf.histogram_summary(layer_name + ‘/outputs’, outputs)
return outputs
# Make up some real data
x_data = np.linspace(-1, 1, 300)[:, np.newaxis]
noise = np.random.normal(0, 0.05, x_data.shape)
y_data = np.square(x_data) – 0.5 + noise
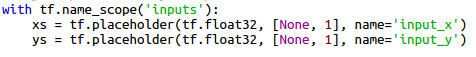
# define placeholder for inputs to network
with tf.name_scope(‘inputs’):
xs = tf.placeholder(tf.float32, [None, 1], name=’x_input’)
ys = tf.placeholder(tf.float32, [None, 1], name=’y_input’)
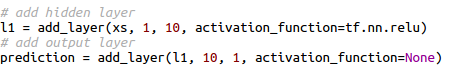
# add hidden layer
l1 = add_layer(xs, 1, 10, n_layer=1, activation_function=tf.nn.relu)
# add output layer
prediction = add_layer(l1, 10, 1, n_layer=2, activation_function=None)
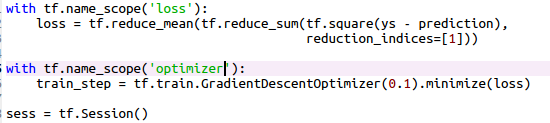
# the error between prediciton and real data
with tf.name_scope(‘loss’):
loss = tf.reduce_mean(tf.reduce_sum(tf.square(ys – prediction),
reduction_indices=[1]))
tf.scalar_summary(‘loss’, loss)
與histogram不同,上面是要加入event的語法
with tf.name_scope(‘train’):
train_step = tf.train.GradientDescentOptimizer(0.1).minimize(loss)
sess = tf.Session()
merged = tf.merge_all_summaries()
writer = tf.train.SummaryWriter(“logs/”, sess.graph)
# important step
sess.run(tf.initialize_all_variables())
for i in range(1000):
sess.run(train_step, feed_dict={xs: x_data, ys: y_data})
if i % 50 == 0:
result = sess.run(merged,feed_dict={xs: x_data, ys: y_data})
writer.add_summary(result, i)
每50步更新一次tensorboard
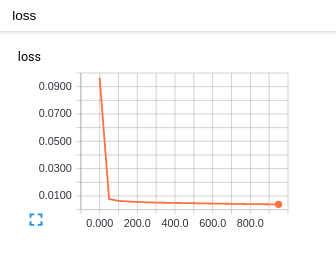
底下為結果圖:
讚
版主回覆:(10/25/2017 12:09:43 PM)
^.^