內容目錄
引言:程式裡的「時間小偷」
你有沒有遇過這種情況?程式碼明明寫好了,卻執行得比預期慢十倍。問題是——到底是哪一段程式偷走了時間?這時候,我們需要一個偵探,來幫我們追蹤程式的每一步。在 Python 裡,這個偵探就是 cProfile。
什麼是 cProfile?
- **cProfile** 是 Python 內建的 profiler。
- 它會記錄每個函數被呼叫幾次、耗時多久,以及整個呼叫鏈的時間。
- 特色是 **不用安裝額外套件**,隨 Python 就能用。
如何使用 cProfile?
- 最簡單的方式是在終端機直接跑:
    - > python -m cProfile myscript.py

- 或是指定排序方式:
    - > python -m cProfile -s cumtime myscript.py
- 這樣會把輸出結果依「累積時間」排序,讓你快速看到瓶頸在哪裡。
Example usage
import time

def fast_func():
    return sum(range(100))

def slow_func():
    total = 0
    for i in range(10000):
    total += i ** 2
    return total

def main():
    for _ in range(5):
        fast_func()
    for _ in range(3):
        slow_func()

if __name__ == "__main__":
import cProfile
cProfile.run("main()", sort="cumtime")
- result
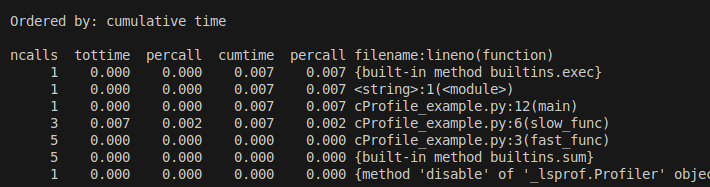
**ncalls**:函數被呼叫的次數。
**tottime**→函數本身的執行時間(不含子函數)。
**percall**(第一個):tottime / ncalls,平均單次執行時間。
**cumtime**→累積時間,包含函數本身與子函數的耗時。
**percall**(第二個):cumtime / ncalls,整個呼叫鏈的平均耗時。
👉 從這份報表可以看到,slow_func 是整個程式的瓶頸。 -
視覺化分析:讓數字變成圖
- 文字表格有時候看久了會眼花,我們可以用圖表來看。
- 常見的做法有兩種:
-
方法一:Snakeviz
- 安裝:
-
pip install snakeviz
-
- 執行:
-
python -m cProfile -o output.prof myscript.py
snakeviz output.prof
-
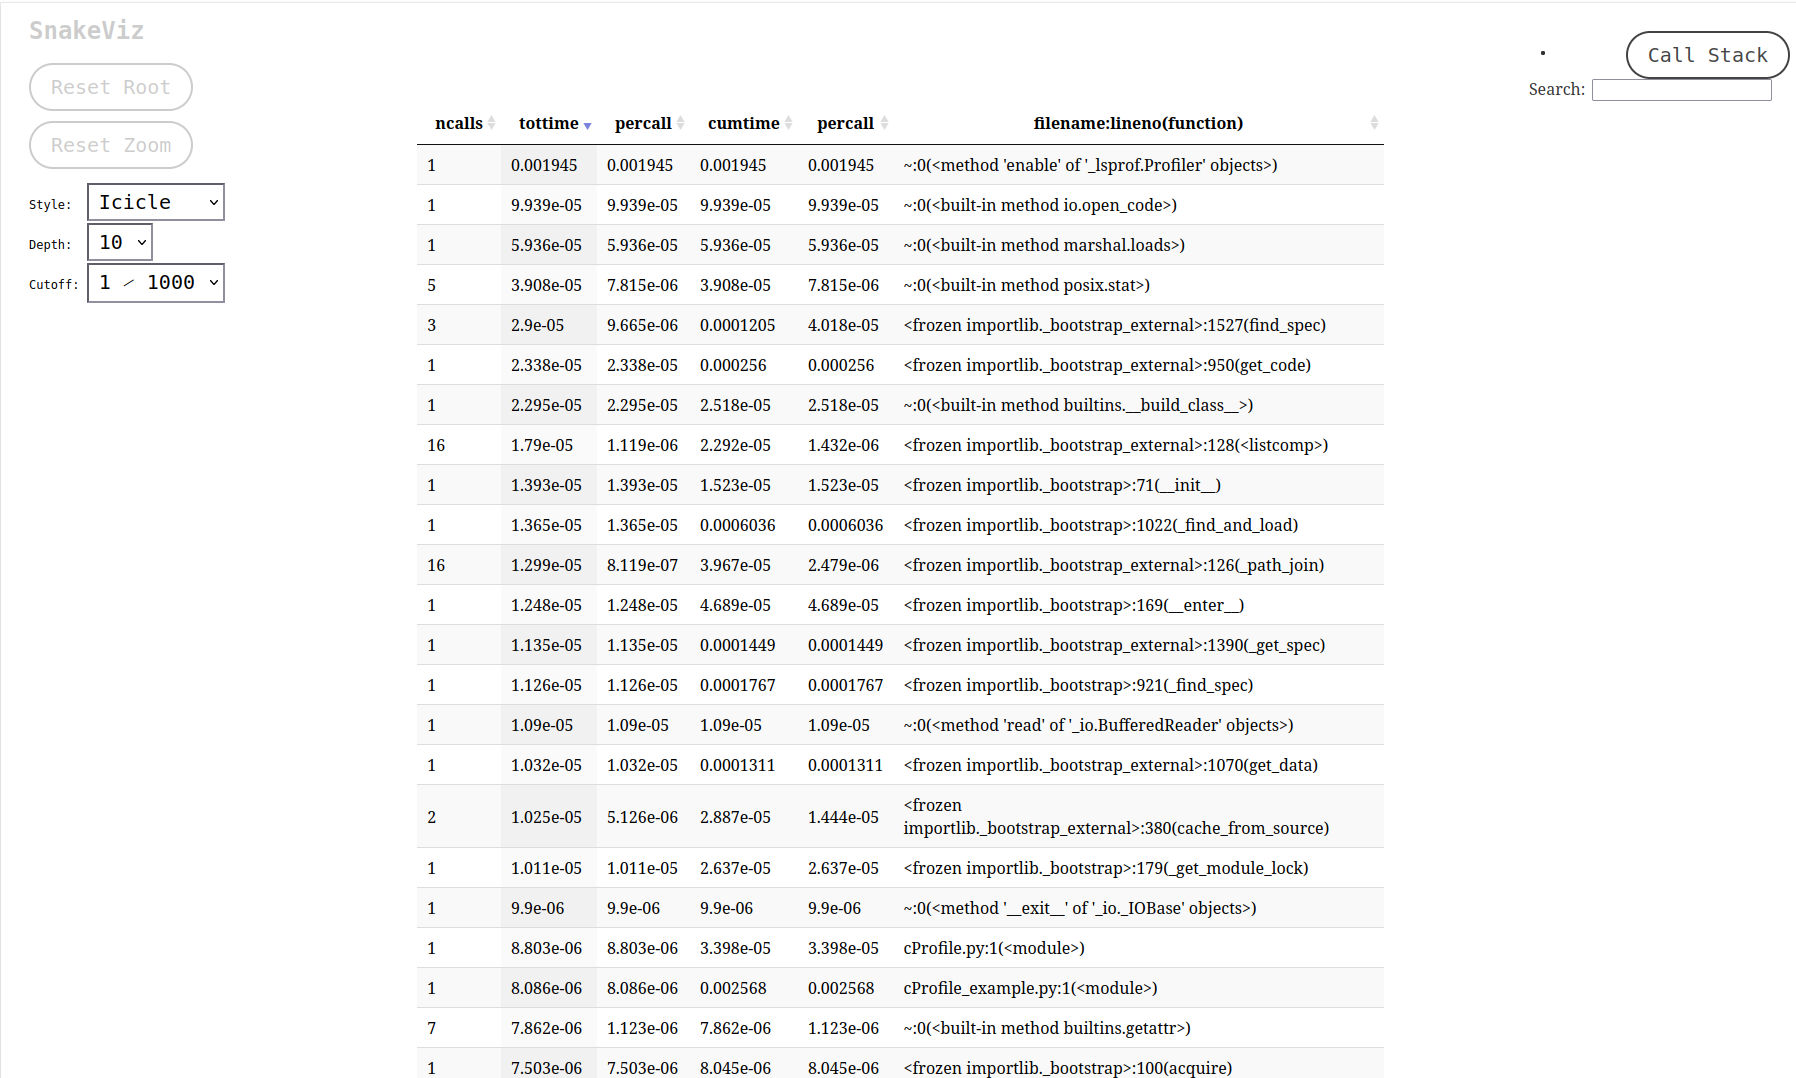
- 這會在瀏覽器打開一個互動頁面,用「旭日圖 (sunburst chart)」的方式顯示函數耗時。
- 安裝:
-
方法二:Graphviz 呼叫樹
- 安裝:
-
pip install gprof2dot
sudo apt-get install graphviz
-
- 生成呼叫圖:
-
python -m cProfile -o output.prof myscript.py
gprof2dot -f pstats output.prof | dot -Tpng -o callgraph.png 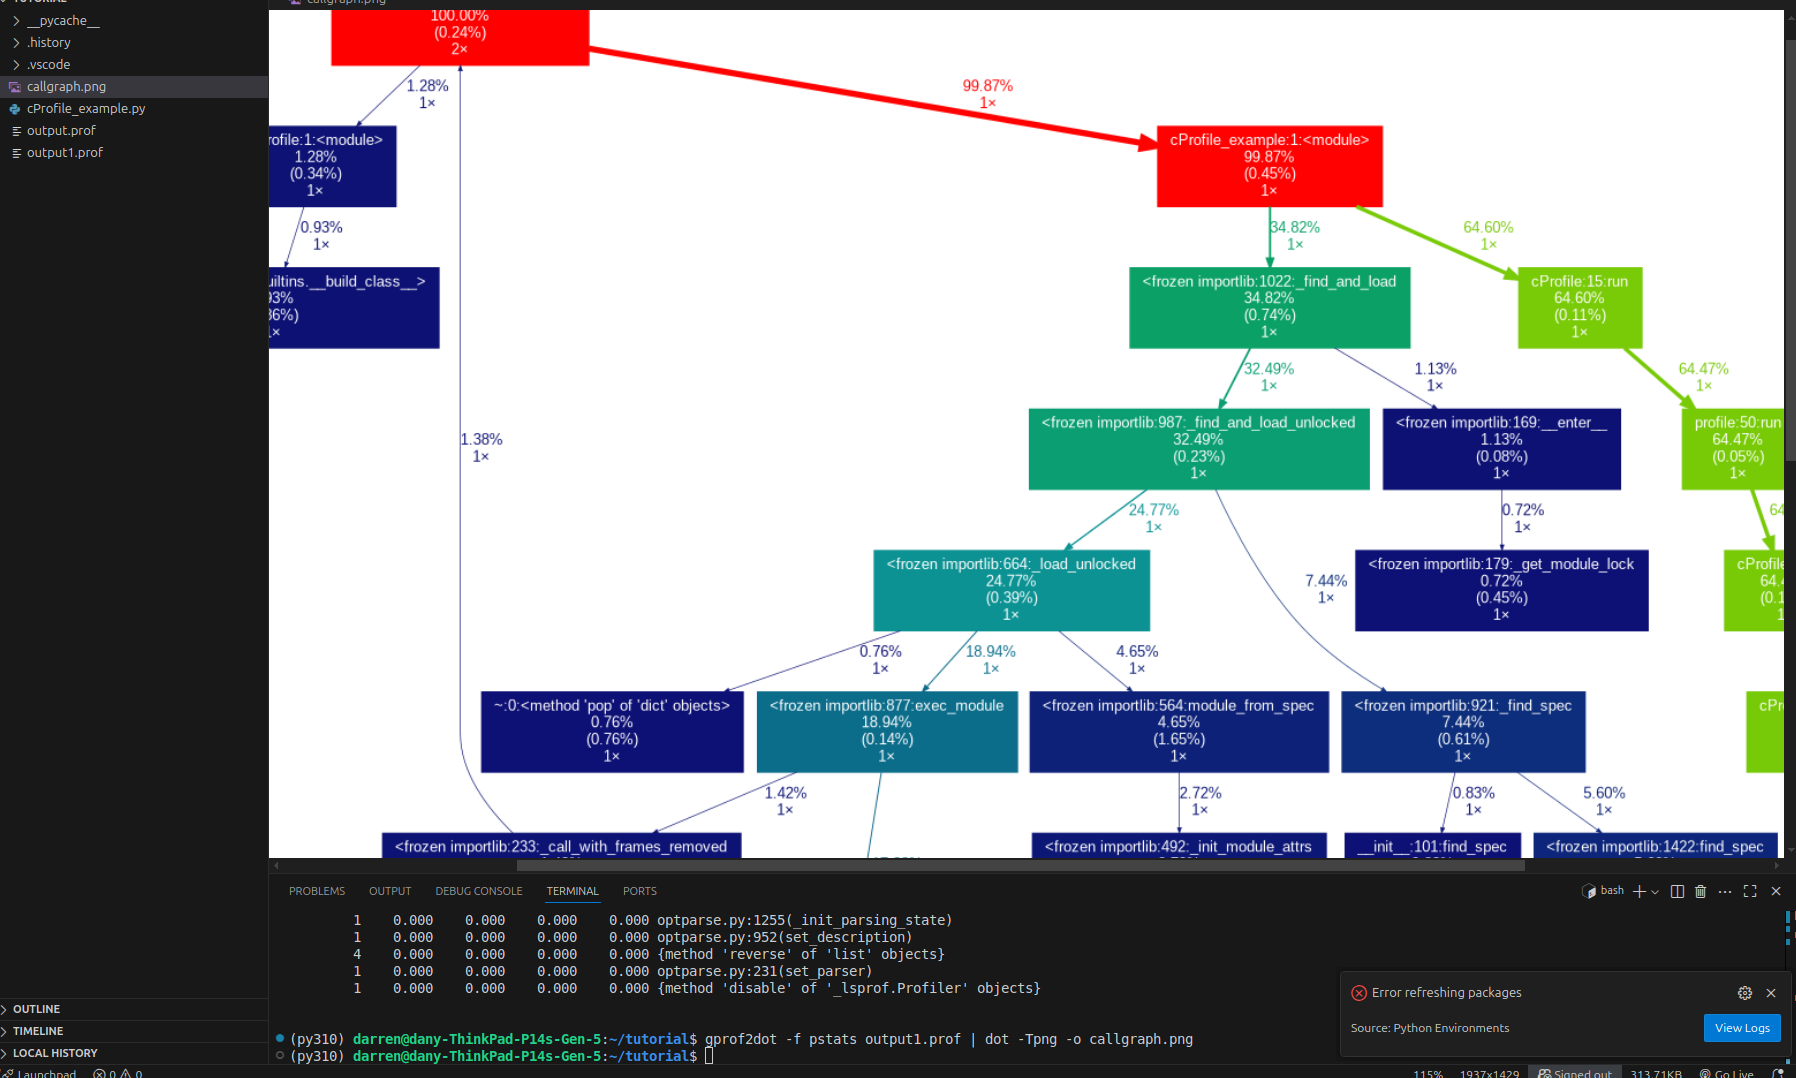
-
顏色代表什麼?
- 顏色越紅→表示這個函數越耗時(hotspot)。
- 顏色越藍→表示這個函數花的時間很少。
- 綠色→中間狀態,表示有一定的花費,但不是瓶頸。
- 👉 所以 紅色的節點就是時間小偷,最需要關注。
- 每個方框裡通常有三行數據
- function name: 函數的名稱(有時會帶檔名與行號,例如
example.py:6(slow_func))。 - total time % ( self time % )
- totoal time→這個函數 含子呼叫 的總耗時佔比↔相當於 cProfile 的 cumtime。
- self time→這個函數「自身」的耗時佔比(不含子呼叫)相當於 cProfile 的 tottime。
- 👉 外面的數字大,表示這條呼叫鏈影響很大;括號裡大,表示這個函數本身就很慢。
- total calls: 這個函數被呼叫的總次數,對應 cProfile 的 ncalls。
- function name: 函數的名稱(有時會帶檔名與行號,例如
-
- 安裝:
-
參考資料